Distance Time Graph


Distance Time Graph
Distance Time Graph: It is the Graphical Representation of Motion. Graphs are used to represent a relation between two quantities. The value of one quantity is caluculated for different values of the other quantity and is then plotted on the graph. In order to describe the motion of an object, we can use line graphs. In this case, line graphs show dependence of one physical quantity, such as distance or velocity to another quantity, such as time.
Distance and Time Graphs: The distance travelled by the object at equal intervals of time (like every second or every minute), will give a clearer picture of its speed at different points of time. The data of the distance travelled and the time taken can be presented in many ways. One method would be to make a table. The information given in table can also be represented in a graph. This kind of a chart is called a line chart or line graph. It is created by plotting series of data points and connecting them to form a line.
Other commonly used charts are bar graphs and pie charts. They are generally used for representing statistical data
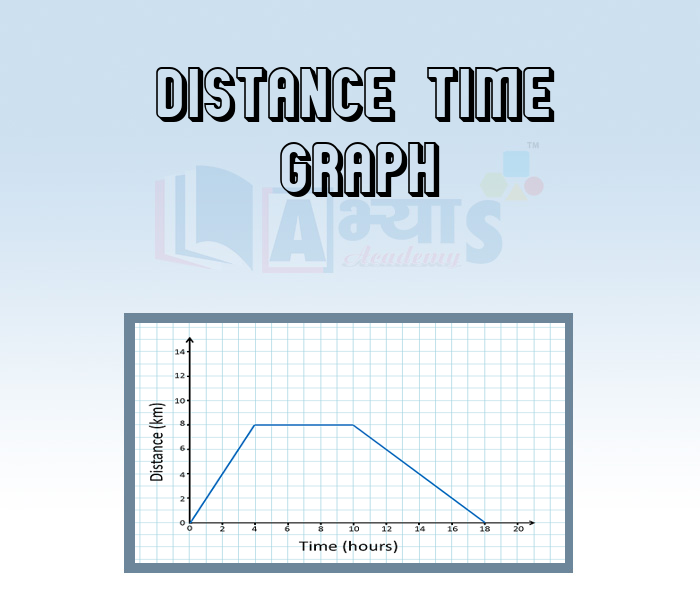
We can get the following points by examining the distance- time graph.
1. The steepness of the slope of the graph gives the speed. If the slope is greater, the speed is greater .
2. The speed is zero if the graph is flat (i.e, parallel to the ‘time’ axis).
If we assume that the vehicle moves at constant speed, i.e, it covers the same distance in equal intervals of time.
Using Motion-Time Graph
On such a linear graph, we generally choose the x-axis as the ‘time axis’ (independent variable) and the y-axis as ‘distance- axis’ (dependent variable)
We plot the distance- time graph be following the steps given below:
1. We choose appropriate scales to represent values of distance and time on the graph. The scale should not be too large or too small.
2. Mark the value for the distance and time on their respective axis, according to the chosen scale.
3. Next mark the points on the graph according to the given set of their values.
4. Join all the points on the graph.
For an object having a uniform motion, the distance – time graph would be a straight line, inclined to the time axis. However, if the speed of the object is changing ( non- uniform motion), the graph can have any shape whatsoever.
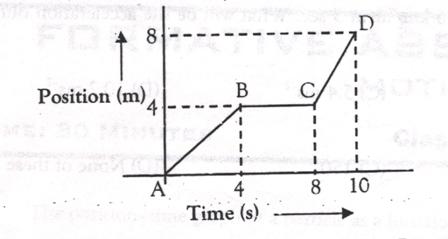
The velocity of the car whose motion is shwon the distance time graph from B to C | |||
| Right Option : D | |||
| View Explanation | |||
A ball is thrown vertically upwards which the following distance time graph indicates this motion? | |||
| Right Option : D | |||
| View Explanation | |||
The distance between Delhi and Mumbai is usually expressed in units of | |||
| Right Option : D | |||
| View Explanation | |||
Students / Parents Reviews [10]
It was a good experience with Abhyas Academy. I even faced problems in starting but slowly and steadily overcomed. Especially reasoning classes helped me a lot.

Cheshta
10thIt has a great methodology. Students here can get analysis to their test quickly.We can learn easily through PPTs and the testing methods are good. We know that where we have to practice

Barkha Arora
10thI have spent a wonderful time in Abhyas academy. It has made my reasoning more apt, English more stronger and Maths an interesting subject for me. It has given me a habbit of self studying

Yatharthi Sharma
10thOne of the best institutes to develope a child interest in studies.Provides SST and English knowledge also unlike other institutes. Teachers are co operative and friendly online tests andPPT develope practical knowledge also.

Aman Kumar Shrivastava
10thAbhyas is a complete education Institute. Here extreme care is taken by teacher with the help of regular exam. Extra classes also conducted by the institute, if the student is weak.

Om Umang
10thAbout Abhyas metholodology the teachers are very nice and hardworking toward students.The Centre Head Mrs Anu Sethi is also a brilliant teacher.Abhyas has taught me how to overcome problems and has always taken my doubts and suppoeted me.

Shreya Shrivastava
8thA marvelous experience with Abhyas. I am glad to share that my ward has achieved more than enough at the Ambala ABHYAS centre. Years have passed on and more and more he has gained. May the centre flourish and develop day by day by the grace of God.

Archit Segal
7thMy experience with Abhyas is very good. I have learnt many things here like vedic maths and reasoning also. Teachers here first take our doubts and then there are assignments to verify our weak points.

Shivam Rana
7thIt was good as the experience because as we had come here we had been improved in a such envirnment created here.Extra is taught which is beneficial for future.

Eshan Arora
8thBeing a parent, I saw my daughter improvement in her studies by seeing a good result in all day to day compititive exam TMO, NSO, IEO etc and as well as studies. I have got a fruitful result from my daughter.